- 您现在的位置:买卖IC网 > Sheet目录242 > PFE1100-12-054ND (Power-One)FRONT END 1100W 12V HI EFFICINCY
DATA SHEET
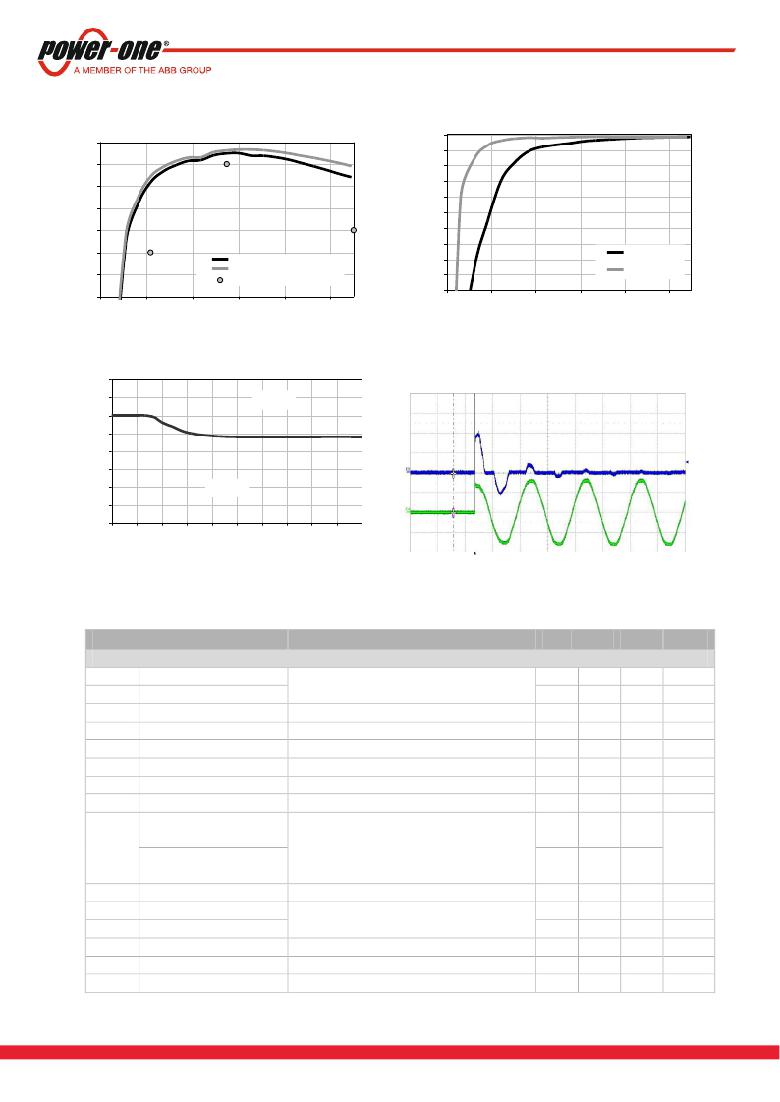
Figure 2 - Efficiency vs. Load current (ratio metric loading)
95
94
93
92
91
1
0.98
0.96
0.94
0.92
0.9
0.88
0.86
Figure 3 - Power factor vs. Load current
90
89
Vi = 230Vac, fan internal
Vi = 230Vac, fan external
Platinum
0.84
0.82
Vi = 230Vac
Vi = 115Vac
88
0
200
400
600
Po [W]
800
1000
0.8
0
200
400
600
Po [W]
800
1000
16
Figure 4 - PFC Stability region
Figure 5 - Inrush current, V in = 230Vac, 90°
CH4 : V in (200V/div), CH3 : I in (20A/div)
14
12
10
8
6
4
2
0
Stable
Unstable
0
100
200
300
400
500
600
700
800
900 1000
Line Inductance [uH]
5
OUTPUT
General Condition: T a = 0 … +45 °C unless otherwise noted.
PARAMETER
DESCRIPTION / CONDITION
MIN
NOM
MAX
UNIT
Main Output V 1
V 1 nom
V 1 set
dV 1 tot
Nominal Output Voltage
Output Setpoint Accuracy
Total Regulation
0.5 ? I 1 nom , T amb = 25 °C
V i min to V i max , 0 to 100% I 1 nom , T a min to T a max
-0.5
-1
12.0
+0.5
+1
VDC
% V 1 nom
% V 1 nom
P 1 nom
I 1 nom
v 1 pp
dV 1 Load
dV 1 Line
Nominal Output Power
Nominal Output Current
Output Ripple Voltage
Load Regulation
Line Regulation
Current Limitation
V 1 = 12 VDC
V 1 = 12 VDC
V 1 nom , I 1 nom , 20MHz BW (See Section 5.1)
V i = V i nom , 0 - 100 % I 1 nom
V i =V i min… V i max
V i > 115 VAC, T a < 45°C
93.5
1080
90.0
60
0
150
100
W
ADC
mVpp
mV
mV
I 1 max
dI share
dV dyn
T rec
t AC V1
t V1 rise
C Load
PFE1100-12-054NA
Current Limitation
PFE1100-12-054RA
Current Sharing
Dynamic Load Regulation
Recovery Time
Start-up Time from AC
Rise Time
Capacitive Loading
V i > 90 VAC, T a < 45°C
V i > 180 VAC, T a < 45°C
V i > 90 VAC, T a < 45°C
Deviation from I 1 tot / N, I 1 > 10%
Δ I 1 = 50% I 1 nom , I 1 = 5 … 100% I 1 nom ,
d I 1 /d t = 1A/μs, recovery within 1% of V 1 nom
T a = 25°C
74
91
71
-3
-0.6
1
78
95
75
+3
0.6
1
2
10
30000
ADC
A
V
ms
sec
ms
μF
PFE1100-12-054xA
4
www.power-one.com
发布紧急采购,3分钟左右您将得到回复。
相关PDF资料
PFE500S-28/T
PWR SUP AC/DC 85-265VAC 28V
PFE700S-48
PWR SUP AC-DC 85-265VAC 51V 14A
PFE850-12-054RA
FRONT END 850W 12V HI EFFICIENCY
PGB1040805NR
SUPPRESSOR ESD 24VDC 0805 SMD
PGB2010402KRHF
SUPPRESSOR ESD 12VDC 0402 SMD
PHW603616
BOX FIBER 63.5X36.5X18.1" GREY
PI-1902
BOX ABS 1.26" X 1.97" X 3.54"GRY
PI-1905
BOX ABS 1.97" X 2.36" X 4.72"GRY
相关代理商/技术参数
PFE1100-12-054RA
功能描述:FRONT END 1100W 12V HI EFFICINCY RoHS:是 类别:电源 - 外部/内部(非板载) >> AC DC 转换器 系列:* 产品培训模块:MP Modular-Configurable AC-DC Power Supply 特色产品:Configurable Power Supplies 标准包装:1 系列:MP
PFE1100-12-054RD
制造商:Power-One 功能描述:- Trays 制造商:Power-One 功能描述:Power One PFE1100-12-054RD DC to DC
PFE-12
制造商:FAIRFORD ELECTRONICS 功能描述:SOFTSTARTER PFE-12 22A 制造商:FAIRFORD ELECTRONICS 功能描述:SOFTSTARTER, PFE-12 22A 制造商:FAIRFORD ELECTRONICS 功能描述:SOFTSTARTER, PFE-12 22A; Supply Voltage Range:230V AC to 460V AC; No. of Phases:Three; Power Rating:15hp; Current Rating:22A; Operating Temperature Min:0C; Operating Temperature Max:40C; Approval Bodies:IEC; Control Voltage DC ;RoHS Compliant: NA
PFE12HSX-U
功能描述:线性和开关式电源 240W 12V 36A RoHS:否 制造商:TDK-Lambda 产品:Switching Supplies 开放式框架/封闭式:Enclosed 输出功率额定值:800 W 输入电压:85 VAC to 265 VAC 输出端数量:1 输出电压(通道 1):20 V 输出电流(通道 1):40 A 商用/医用: 输出电压(通道 2): 输出电流(通道 2): 安装风格:Rack 长度: 宽度: 高度:
PFE12HSX-U1
功能描述:线性和开关式电源 240W 12V 36A RoHS:否 制造商:TDK-Lambda 产品:Switching Supplies 开放式框架/封闭式:Enclosed 输出功率额定值:800 W 输入电压:85 VAC to 265 VAC 输出端数量:1 输出电压(通道 1):20 V 输出电流(通道 1):40 A 商用/医用: 输出电压(通道 2): 输出电流(通道 2): 安装风格:Rack 长度: 宽度: 高度:
PFE12HSX-U-P
功能描述:线性和开关式电源 240W 12V W/COVER RoHS:否 制造商:TDK-Lambda 产品:Switching Supplies 开放式框架/封闭式:Enclosed 输出功率额定值:800 W 输入电压:85 VAC to 265 VAC 输出端数量:1 输出电压(通道 1):20 V 输出电流(通道 1):40 A 商用/医用: 输出电压(通道 2): 输出电流(通道 2): 安装风格:Rack 长度: 宽度: 高度:
PFE1300-48-054NA
功能描述:POWER SUPPLY FRONT END 1.3KW FAN 制造商:bel power solutions 系列:PFE1300 零件状态:有效 类型:前端 输出数:1 电压 - 输入:90 ~ 264 VAC 电压 - 输出 1:48V 电压 - 输出 2:- 电压 - 输出 3:- 电压 - 输出 4:- 电流 - 输出(最大值):26.8A 功率(W):1300W 应用:ITE(商业) 电压 - 隔离:4.242kV(4242V) 效率:94% 工作温度:0°C ~ 45°C 特性:可调输出,热插拔,I2C? 接口,负载均分,PFC,PMBus?,远程开/关,遥测,待机输出 安装类型:机架安装 大小/尺寸:12.66" 长 x 2.15" 宽 x 1.57" 高(321.5mm x 54.5mm x 40.0mm) 所需最小负载:- 认可:CB,cCSAus,CE,NEMKO 功率(W) - 最大值:1286W 标准包装:30
PFE-14
制造商:FAIRFORD ELECTRONICS 功能描述:SOFTSTARTER PFE-14 30A 制造商:FAIRFORD ELECTRONICS 功能描述:SOFTSTARTER, PFE-14 30A 制造商:FAIRFORD ELECTRONICS 功能描述:SOFTSTARTER, PFE-14 30A; Supply Voltage Range:230V AC to 460V AC; No. of Phases:Three; Power Rating:20hp; Current Rating:30A; Operating Temperature Min:0C; Operating Temperature Max:40C; Approval Bodies:IEC; Control Voltage DC ;RoHS Compliant: NA
